
Side by Side: Intro & First Project
What is Side by Side?
A project where I'll remake my Data Studio visualizations in Tableau
Why?
Google Data Studio is the first data visualization software I learned to use and I found it easy to pick up.
However, I know that Tableau has a larger community and recognize that Tableau has many features that Data Studio doesn't support. I have tried to make visualizations purely in Tableau but found it challenging to master the interface.
I've also found a video illustrating the dual axis - Gantt chart method of inner labels. For an explanation of the dual axis - Gantt method, check out these resources: 1, 2
2. Setting a background colour
‣ for a Worksheet: Format > Shading
‣ for a Dashboard text box: Layout tab > Background

A project where I'll remake my Data Studio visualizations in Tableau
Why?
Google Data Studio is the first data visualization software I learned to use and I found it easy to pick up.
However, I know that Tableau has a larger community and recognize that Tableau has many features that Data Studio doesn't support. I have tried to make visualizations purely in Tableau but found it challenging to master the interface.
I'm using this Side by Side series as an opportunity to learn Tableau. Having a pre-existing visualization as a guideline will help me focus more on learning Tableau capabilities and worry less about design decisions.
------------------------
Project 1: Words in Info We Trust
I'm starting off with my Info we Trust visualization as it was very simple to make in Data Studio. However, I've learned that what may be simple to make in one software may not be as simple to make in another.
Final viz in Tableau:
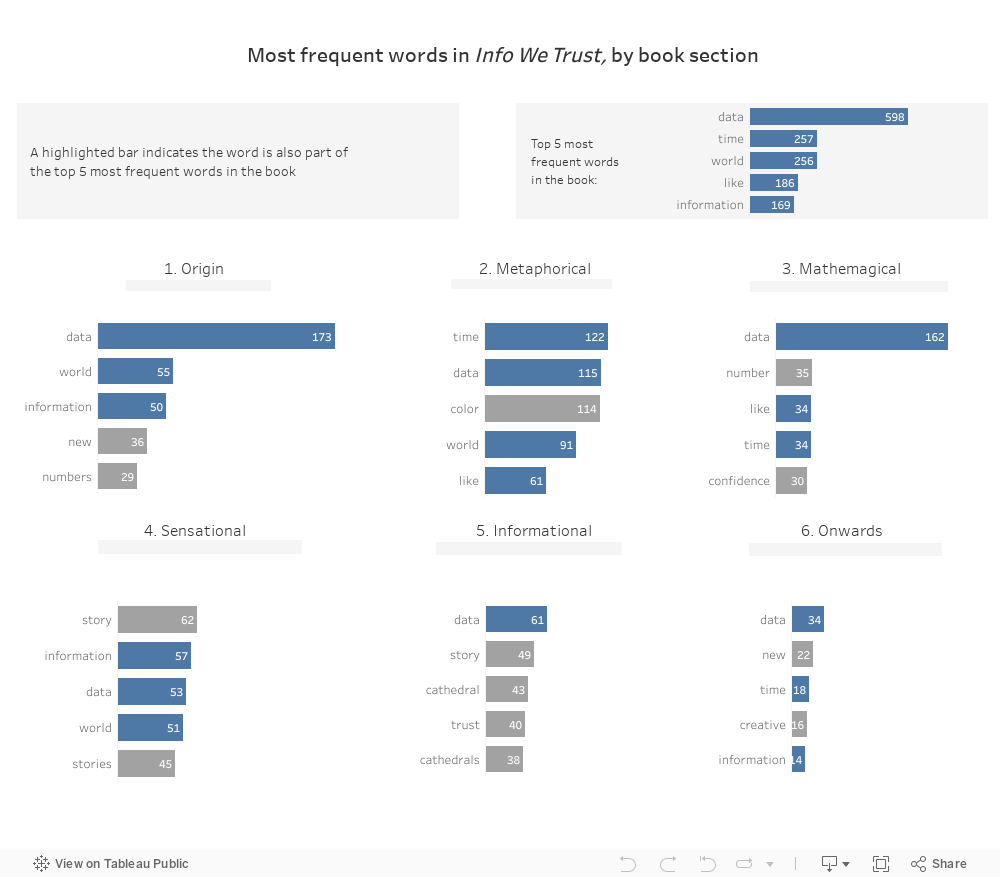
Final viz in Tableau:
Learnings
1. Bar labels
Labels in Data Studio appears inside the bar by default, unless the bar is too short. In Tableau, labels appear outside of the bar.
Solution found - use reference lines (example 3)
To replicate inner labels in Tableau, I created a reference line and made the scope per cell. I then had to format the reference line's font and alignment. The key step is to left align the reference line.
Solution found - use reference lines (example 3)
To replicate inner labels in Tableau, I created a reference line and made the scope per cell. I then had to format the reference line's font and alignment. The key step is to left align the reference line.
I've also found a video illustrating the dual axis - Gantt chart method of inner labels. For an explanation of the dual axis - Gantt method, check out these resources: 1, 2
2. Setting a background colour
‣ for a Worksheet: Format > Shading
‣ for a Dashboard text box: Layout tab > Background
3. Dashboard box size
Tiled boxes have a minimum height of ~30px but floating boxes can be any size
4. Floating boxes
I don't want to float everything but it seems like floating is the easiest way to achieve my desired design ie. the picture below. When I tried to use tiles, I found that there was white space between boxes.

Remaining Questions
Styling across elements
- Is it possible to copy a dashboard element (ex. copy a text box with same dimensions and styling)?
- If not, how can you make multiple charts the same size without eyeballing it?
- How can you apply the same background colour to multiple text boxes? (Without having to adjust each box individually)
- How do you ensure that charts on a dashboard are all the same size?
Do you have suggestions for my remaining questions or shortcuts? I'd love to hear from you; please leave a comment below or message me on twitter!


Comments
Post a Comment